--Full Year Revenue of $210.0 million, up 22.9% year-over-year --
2023-05-16
Shanghai, China, May 15, 2023 (PRNewswire) -- Jowell Global Ltd. (“Jowell” or the “Company”) (NASDAQ: JWEL), a leading cosmetics, health and nutritional supplements, and household products e-commerce platforms in China, today announced its financial results for the full year ended December 31, 2022.
Full Year 2022 Financial and Operational Highlights
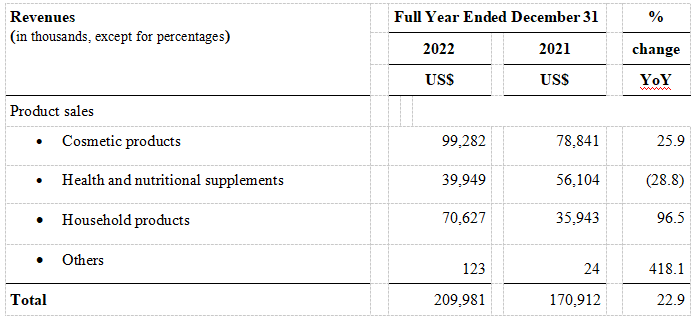
- Total revenueswere $210.0 million, an increase of 22.9% from $170.9 million in 2021.
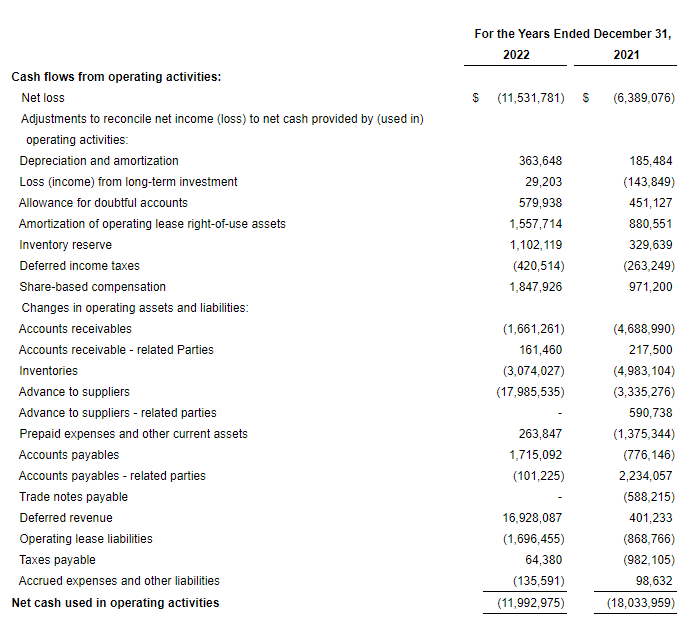
- Net loss was $11.5 million, an increase of 80.5% compared to net loss of $6.4 million in 2021.
- Total VIP members1 as of December 31, 2022 were approximately 2.4 million, an increase of 9.1% compared to approximately 2.2 million as of December 31, 2021.
- Total LHH stores2 as of December 31, 2022 were 26,414, an increase of 1.4% compared to 26,043 as of December 31, 2021.
1“Total VIP members refers to the total number of members registered on Jowell’s platform as of March 31, 2022.
2LHH stores: the brand name of “Love Home Store”. Authorized retailers may operate as independent stores or store-in-shop (an integrated store), selling products they purchased through Jowell’s online platform LHH Mall under their retailer accounts which provides them with major discounts.
Mr. Haiting Li, Chief Executive Officer and Chairman of Jowell Global Ltd., remarked: “We're excited to announce our impressive revenue growth for 2022, a landmark year for Jowell. As a company listed on the Nasdaq Capital Market since 2021, it has bolstered our industry standing and widened our brand visibility. We successfully grew our total revenue to an unprecedented $210 million in 2022, despite the hurdles presented by the pandemic and macroeconomic uncertainties. These achievements attest to Jowell's effective positioning in the new retail landscape, catering to the evolving needs of today's consumers.”
Mr. Li added: “Our ongoing collaborations with top consumer brands and consistent marketing efforts allow us to deliver high-quality local and international products to millions of households in China. Furthermore, our dedication to refining both online and offline consumer experiences has led to customer loyalty and the expansion of our customer base. By the close of 2022, we had amassed a record-breaking 2.4 million VIP members.”
“As we step into 2023, we continue to see significant opportunities in the new live streaming e-commerce retail market, despite the challenging, ever-changing market conditions. Our cross-platform online and offline sales and distribution networks provide convenient shopping and delivery options tailored to customer needs. We have incorporated a new wholly owned subsidiary Shanghai Lianfu Information Technology Co., Ltd. in April 2023, which will focus on live streaming sales of agricultural and fishing products from farms and fishing docks by influencers. Leveraging our proficiency in reaching consumers through multiple channels, we deliver effective sales and marketing solutions for our business partners. Our commitment to enhancing our platforms and diversifying our product offerings will remain steadfast as we aim to meet the increasingly varied demands of consumers.”
Mr. Lu Qian, Chief Financial Officer, chimed in: “Jowell witnessed outstanding revenue growth in 2022, recording a year-over-year increase of 22.9%, and expanded our LHH store network to 26,414 locations. This progress demonstrates our effective execution and potent marketing strategy, enabling us to navigate the unparalleled challenges in the retail sector amid the pandemic. Throughout 2021, we ramped up marketing efforts in conjunction with Jowell's IPO on Nasdaq listing. Although the implementation of our business plan in increase of premium products and brands, increased cost of units purchased from our suppliers and enhanced GMV quality has led to an increased net loss in 2022, we firmly believe these investments are pivotal to boosting user traffic, increasing our revenues, and growing our customer and distributor base. As we move forward, we remain dedicated to implementing our long-term growth strategy while continue to control our expenses in order to realize profitability for the Company.”
Full Year 2022 Financial Results
Total Revenues
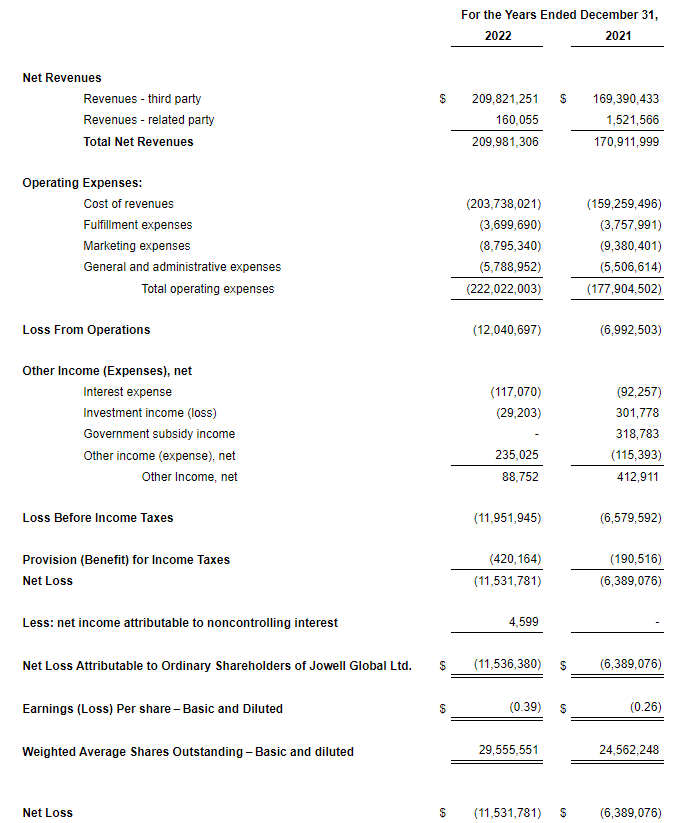
Total revenues were $210.0 million, representing an increase of 22.9% from $170.9 million in 2021, primarily due to an increase in our brand reach to distribute more premium branded products, with an increase in average unit price. Cosmetics and household products lead the growth, with an increase of 25.9% and 96.5%, respectively.
Total operating were $222.0 million, an increase of 24.8% from the $177.9 million in 2021.
- Costs of revenues were $203.7 million, an increase of 27.9% from the $159.3 million in 2021. The increase is attributable to an increase in the weighted average unit cost. This was because the Company has sold more premium brand products, which are higher in unit cost than its self-branded and other generic products. Cost of revenue as a percentage of total revenues was 97.0% in 2022, up from 93.2% in 2021.
- Fulfillment expenses primarily consist of costs related to order fulfillment, including expenses paid for order preparing, packaging, outbound freight, and physical storage. Fulfillment expenses were $3.7 million, a decrease of 1.6% from the $3.8 million in 2021. The fulfillment expenses as a percentage of total revenues were 1.8% in 2022, down from 2.2% in 2021. The decrease was mainly due to more large customers elected to self-pickup products purchased from our facilities which led to decrease in outbound freight costs as a percentage of the revenues.
- Marketing expenses primarily consist of targeted online advertising, payroll and related expenses for personnel engaged in marketing and selling activities. Marketing expenses were $8.8 million, a decrease of 6.2% from the $9.4 million in 2021. The decrease was primarily due to the decreased marketing and promotion activities. In the second half of 2021, we have spent decent amounts of advertising fees in preparing sales festivals to boost customer orders. However, in 2022, as more Covid-19 related restrictions and lock-downs were imposed by Chinese local governments, we cancelled some promotional events and marketing activities, which also led to a slowdown of our increase in sales orders.
- General and administrative expenses mainly consist of payroll, depreciation, office supplies and upkeep expenses. General expenses and administration expenses were $5.8 million, an increase of 5.1% from $5.5 million in 2021. The increase was primarily due to $0.9 million increase in share-based compensation of services provided by employees offset by $0.4 million decrease in payroll because decreased headcount in general and administrative personnel, and a $0.2 million decreased expenditure in directors and officers insurance.
Operating loss
Operating loss was $12.0 million, compared with the operating income of $7.0 million in 2021, which was mainly attributable to the implementation of our business plan to increase of premium products and brands, increased cost of units purchased from our suppliers and enhanced GMV quality, which has significantly increased its cost of revenues.
Net loss
Net loss was $11.5 million, an increase of 80.5% compared with net loss of $6.4 million in 2021.
Earnings (Loss) per share
The Company computes earnings (loss) per share (“EPS”) in accordance with ASC 260, “Earnings per Share” (“ASC 260”). The Company’s each Preferred Share has voting rights equal to two Ordinary Shares of the Company and each Preferred Share is convertible into one Ordinary Share at any time. Except for voting rights and conversion rights, the Ordinary Shares and the Preferred Shares shall rank pari passu with one another and shall have the same rights, preferences, privileges and restrictions. For the full year ended December 31, 2022 and 2021, the Company had no potential ordinary shares outstanding that could potentially dilute EPS in the future.
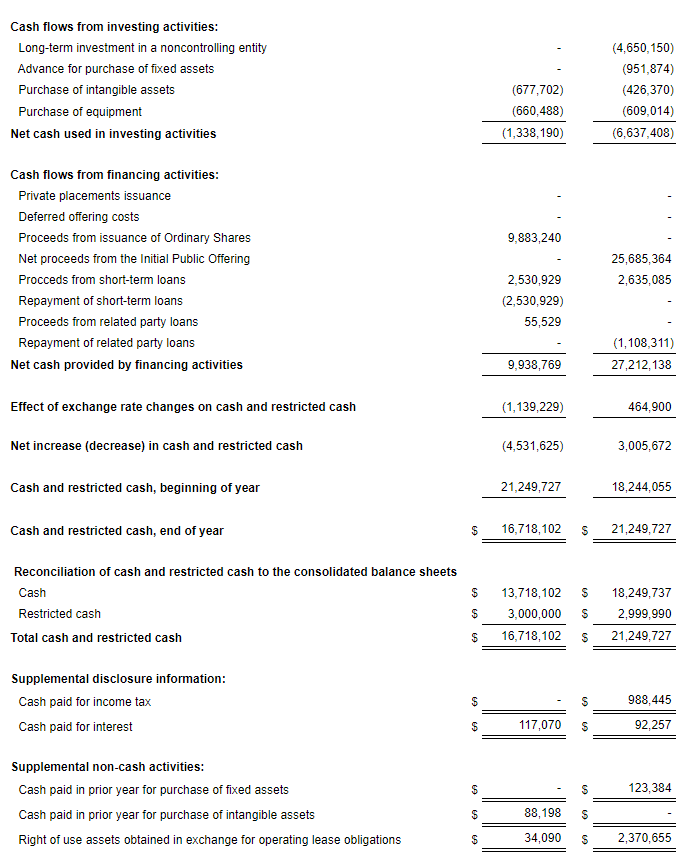
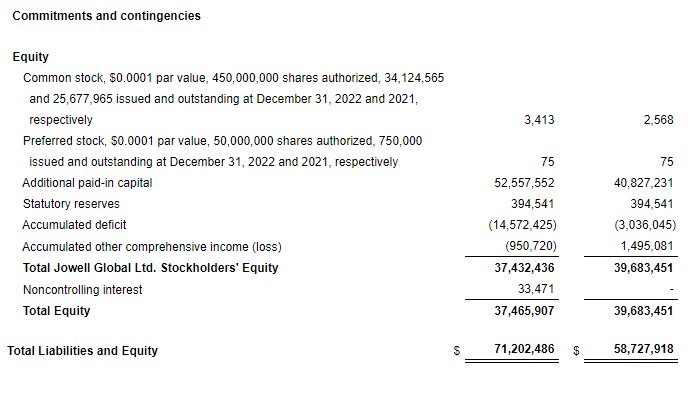
Cash and cash equivalents
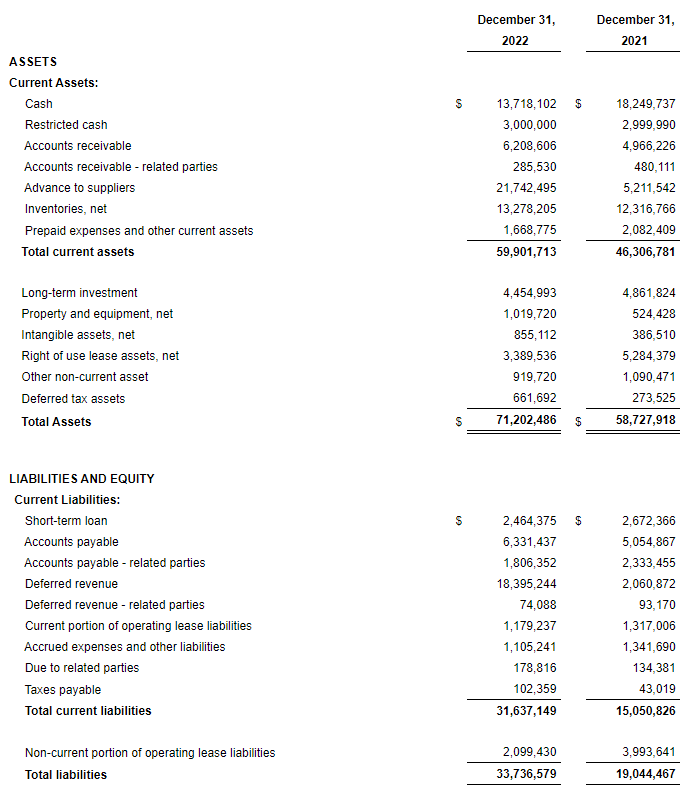
As of December 31, 2022, the Company had cash and cash equivalents $13.7 million, compared to $18.2 million as of December 31, 2021.
About Jowell Global Ltd.
Jowell Global Ltd. (the “Company”) is one of the leading cosmetics, health and nutritional supplements and household products e-commerce platforms in China. We offer our own brand products to customers and also sell and distribute health and nutritional supplements, cosmetic products and certain household products from other companies on our platform. In addition, we allow third parties to open their own stores on our platform for a service fee based upon sale revenues generated from their online stores and we provide them with our unique and valuable information about market needs, enabling them to better manage their sales effort, as well as an effective platform to promote their brands. The Company also sells its products through authorized retail stores all across China, which operate under the brand names of “Love Home Store” or “LHH Store” and “Juhao Best Choice Store”. For more information, please visit http://ir.1juhao.com/Home.html
Exchange Rate
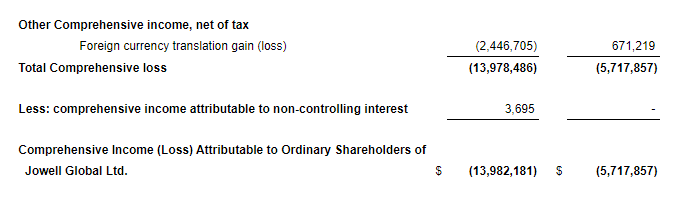
The Company’s financial information is presented in U.S. dollars (“USD”). The functional currency of the Company is the Chinese Yuan, Renminbi (“RMB”), the currency of the PRC. Any transactions which are denominated in currencies other than RMB are translated into RMB at the exchange rate quoted by the People’s Bank of China prevailing at the dates of the transactions, and exchange gains and losses are included in the statements of operations as foreign currency transaction gain or loss. The consolidated financial statements of the Company have been translated into U.S. dollars in accordance with ASC 830, “Foreign Currency Matters”.
This press release contains translations of certain RMB amounts into U.S. dollars (“USD” or “$”) at specified rates solely for the convenience of the reader. The exchange rates in effect as of December 31, 2022 and December 31, 2021 were RMB1 for $0.1450 and $0.1572, respectively. The average exchange rates for the Full Year ended December 31, 2022 and 2021 were RMB1 for $0.1489 and $0.1550, respectively.
Safe Harbor Statement
This press release contains forward-looking statements. These statements are made under the "safe harbor" provisions of the U.S. Private Securities Litigation Reform Act of 1995. Statements that are not historical facts, including statements about the Company's beliefs and expectations, are forward-looking statements. Forward-looking statements involve inherent risks and uncertainties, and a number of factors could cause actual results to differ materially from those contained in any forward-looking statement. In some cases, forward-looking statements can be identified by words or phrases such as "may," "will," "expect," "anticipate," "target," "aim," "estimate," "intend," "plan," "believe," "potential," "continue," "is/are likely to" or other similar expressions. The Company may also make written or oral forward-looking statements in its reports filed with, or furnished to, the U.S. Securities and Exchange Commission, in its annual reports to shareholders, in press releases and other written materials and in oral statements made by its officers, directors or employees to third parties. These statements are subject to uncertainties and risks including, but not limited to, the following: the Company’s goals and strategies; the Company’s future business development; financial condition and results of operations; product and service demand and acceptance; reputation and brand; the impact of competition and pricing; changes in technology; government regulations; fluctuations in general economic and business conditions in China and assumptions underlying or related to any of the foregoing and other risks contained in reports filed by the Company with the SEC. For these reasons, among others, investors are cautioned not to place undue reliance upon any forward-looking statements in this press release. Additional factors are discussed in the Company’s filings with the SEC, which are available for review at www.sec.gov. The Company undertakes no obligation to publicly revise these forward‐looking statements to reflect events or circumstances that arise after the date hereof.
For investor and media inquiries, please contact:
In China:
Jowell Global Ltd.
Ms. Jessie Zhao
Email: IR@1juhao.com
JOWELL GLOBAL LTD
CONSOLIDATED BALANCE SHEETS
JOWELL GLOBAL LTD
CONSOLIDATED STATEMENTS OF OPERATIONS AND COMPREHENSIVE LOSS
JOWELL GLOBAL LTD
CONSOLIDATED STATEMENTS OF CASH FLOWS